

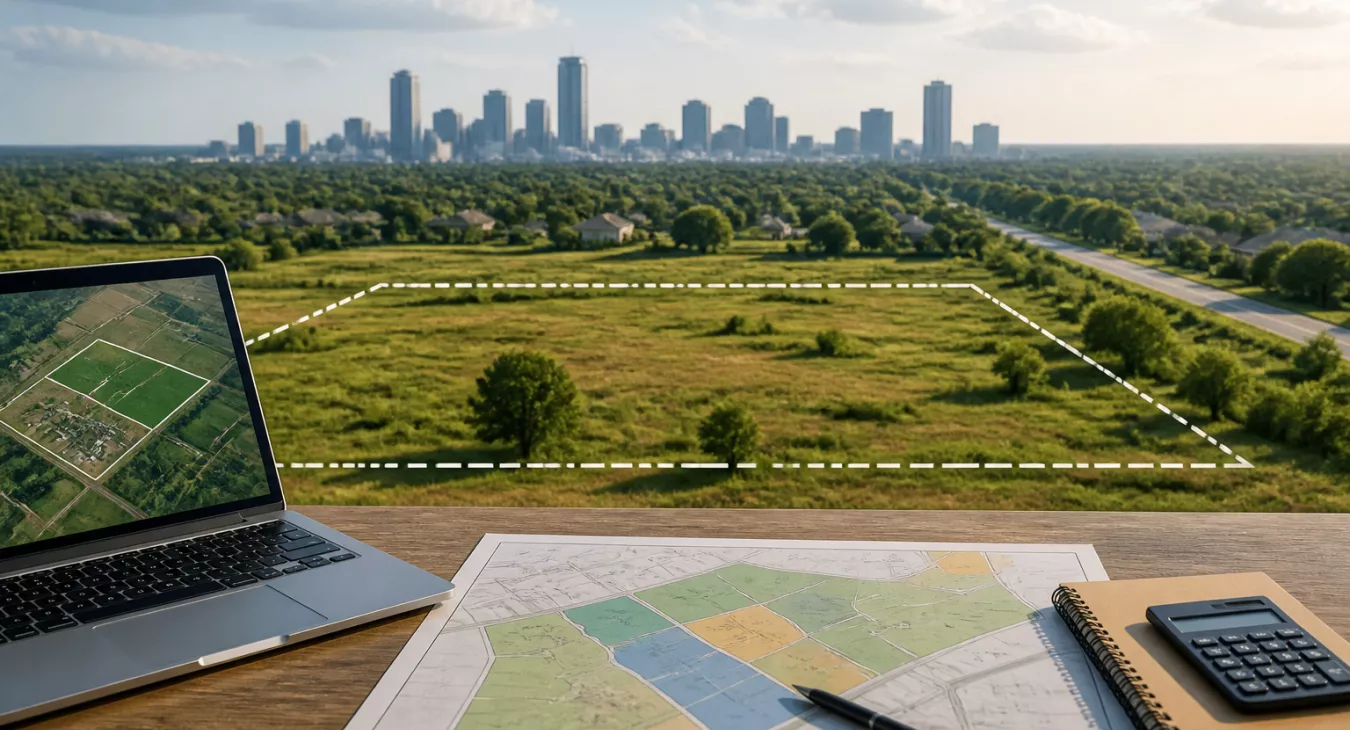
Discover 9 essential metrics to analyze land for investment. Learn how to evaluate raw land like a pro and separate smart deals from risky bets.
Products and Tools Mentioned in this Post



Table of Contents
- Why Land Analysis Requires Its Own Framework
- Metric 1 — Zoning and Entitlement Potential
- Metric 2 — Comparable Sales Analysis (Price Per Acre or Per Square Foot)
- Metric 3 — Capitalization Rate (Adapted for Income-Producing Land)
- Metric 4 — Residual Land Value
- Metric 5 — Return on Investment (ROI) and Holding Cost Analysis
- Metric 6 — Tax Impact on Exit (Capital Gains and NIIT)
- Metric 7 — Environmental and Physical Constraints
- Metric 8 — Location Fundamentals and Infrastructure Proximity
- Metric 9 — Title Quality and Encumbrances
- Putting It Together: A Land Analysis Workflow
- Investment Strategy Context: Matching Metrics to Your Approach
- Common Mistakes in Land Analysis
- Conclusion
- Frequently Asked Questions
Raw land is one of the most misunderstood asset classes in real estate. It produces no rent. No immediate depreciation benefit either. And it can sit idle for years — yet it regularly delivers outsized returns for investors who know exactly what they're looking at before they write a check.
Here's the real problem: most analytical frameworks were built for income-producing properties. Vacant land doesn't fit that mold. You're dealing with parcels that may have no utilities, no permitted use, and no comparable sales within ten miles. Traditional metrics break down fast.
If you've been searching for a clear, metric-driven answer to how to analyze land for investment, you need a better toolkit. This guide gives you nine concrete indicators — grounded in valuation science, due diligence practice, and real market data — that separate a speculative gamble from a calculated position.

Why Land Analysis Requires Its Own Framework
Land comes first in the development chain. Every apartment building, strip mall, and subdivision you see started as raw dirt. And that's the problem — land value is almost entirely anticipatory. The market's pricing what the land could become, not what it's producing today. You can't just run traditional income metrics like NOI and GRM. But they're not worthless either. Land analysis demands you adapt these tools or layer in completely different tests.
Here's what makes land different. With rental properties or commercial assets, you've got leases. You've got trailing twelve-month statements. You can calculate in-place cap rates right now. Land forces you to build the entire financial picture from zero. Want to understand how those traditional income-property metrics actually work before you modify them for land? Check out How to Evaluate Real Estate Investment Returns: Metrics & Analysis Tools.
Back to topMetric 1 — Zoning and Entitlement Potential
Zoning is the single largest driver of land value. Check it first. A parcel's zoning classification determines what you can legally build, at what density, and under what conditions. But here's where most investors stumble:
- Zoning codes aren't standardized nationally. "R-1" might mean a 6,000-square-foot minimum lot in one municipality and a one-acre minimum three towns away. You've got to read the actual local ordinance, not just the label. Don't rely on what it means in the last market you worked.
- Current zoning isn't the ceiling. Rezoning, variances, special-use permits, and planned unit developments can all unlock higher and better uses — but each jurisdiction plays by different rules, timelines, and political dynamics. Never assume entitlement is guaranteed until it's approved in writing. I've seen deals collapse because an investor bet on rezoning that took three years to deny.
Document these specifics in your analysis: what uses are currently permitted, allowable density or floor-area ratio, setback and height restrictions, and whether a full plan amendment is required for what you want to build. That gap between current zoning and highest-and-best-use zoning? That's where land investors find their margin. Want a step-by-step breakdown of navigating zoning and entitlements? Check out Land Development Investment Guide: Zoning, Permits & Profitability.
Back to topMetric 2 — Comparable Sales Analysis (Price Per Acre or Per Square Foot)
Land doesn't produce rent. That's why comps are everything when you're trying to figure out what a parcel is actually worth. Your job is to find recent arm's-length transactions for land that looks similar — same size ballpark, location, zoning, access, utilities, topography.
When you're stacking one sale against another, these adjustments matter:
- Entitlement status (raw vs. permitted vs. shovel-ready)
- Access (public road frontage vs. landlocked with easement vs. no legal access)
- Utility availability (sewer/water at boundary vs. septic/well required)
- Topography and soil bearing capacity
- Environmental constraints (wetlands, floodplain — see Metric 7)
- Market conditions adjustment for time of sale
Rural and agricultural land? Quote it in price per acre. But if you're buying land for urban infill, you'll probably compare on price per square foot or price per entitled unit instead. Want a complete walkthrough on sourcing comps and making the right adjustments? How to Value Land for Investment: Methods & Comparable Analysis breaks down every step.
Back to topMetric 3 — Capitalization Rate (Adapted for Income-Producing Land)
Cap rate works when land actually generates income. Farmland cash rent, billboard leases, hunting leases, timber royalties, cell-tower ground leases — they all follow the same logic: Cap Rate = Net Operating Income ÷ Purchase Price.
Let's look at real numbers from ag land, which gives us a clean benchmark. The USDA NASS 2026 Land Values Summary just reported U.S. average cropland at $6,020 per acre — first time we've crossed $6,000 nationally. Non-irrigated cash rent? $146 per acre. Irrigated? $244 per acre. That gives you a gross yield of roughly 2.4% on non-irrigated land at the national average. But here's the reality check: once you subtract property taxes, insurance, and management costs, net cap rates on farmland are razor-thin. Most farmland investors aren't banking on yield. They're betting on appreciation.
Billboard leasing is different. The income potential's real, but you've got geographic walls. Vermont, Maine, Hawaii, and Alaska? Billboards are flat-out illegal under state law. Most other markets layer on local restrictions too. Don't underwrite billboard income without confirming the regulatory green light first.
| Land Type | Primary Valuation Method | Income Metric Applicable? | Key Value Driver |
|---|---|---|---|
| Cropland (non-irrigated) | Comparable sales + income cap | Yes — cash rent | Soil productivity, water access |
| Cropland (irrigated) | Comparable sales + income cap | Yes — cash rent | Water rights (jurisdiction-specific) |
| Pastureland | Comparable sales | Marginal — grazing leases | Carrying capacity, fencing, water |
| Infill / Residential development | Price per entitled unit / lot | No (pre-development) | Zoning, infrastructure, density |
| Commercial development land | Price per SF + residual land value | No (pre-development) | Traffic counts, demographics, access |
| Timberland | Timber cruise + comparable sales | Yes — timber royalties | Timber volume, species mix, markets |
| Speculative raw land | Comparable sales only | Rarely | Growth trajectory, entitlement path |
Metric 4 — Residual Land Value
Residual land value is the most rigorous method for underwriting development land. It works backward from the end product: Land Value = Completed Project Value − Total Development Costs − Developer Profit. Picture this: a developer builds and sells ten lots for $2 million total. Construction, entitlement, financing, and sales costs run $1.5 million (including required profit margin). That leaves $500,000 as residual land value—and that's your ceiling. Don't pay more than that number.
This method forces discipline. You can't just guess. You've got to estimate construction costs, absorption pace, carrying costs, and developer return—each one carrying real uncertainty. And here's where stress-testing matters: run a scenario where costs spike 10–15% higher and sale prices drop 10%. Does the residual land value in that downside case still pencil for your offer price? If it does, you've got a genuine margin of safety. If not, you're gambling.
Back to topMetric 5 — Return on Investment (ROI) and Holding Cost Analysis
Raw land doesn't throw off income. But it still costs you money to hold it. A solid ROI projection has to account for every dollar that bleeds out of the deal while you're waiting for appreciation.
- Property taxes: They're all over the map depending on where you buy. Some states hand out agricultural exemptions, current-use programs, or preferential assessments to qualifying landowners — problem is, the rules and application deadlines shift from state to state, and you'll face rollback tax consequences if you convert the land later. Before you pencil in reduced tax treatment, get your local program details in writing. Don't assume.
- Insurance: NFIP flood insurance won't touch vacant raw land. Liability coverage exists, but it's minimal. Still, it belongs in your proforma.
- Carrying costs: Loan interest if you're financed. Basic maintenance—mowing, fence repair, whatever the property needs. HOA fees where they apply.
- Opportunity cost: Every dollar locked into non-producing land can't work elsewhere in your portfolio.
Here's the discipline: calculate your break-even appreciation rate. This is the annual value increase you absolutely need just to cover holding costs and your cost of capital. Say your carrying costs run $8,000 a year on a $200,000 parcel. You're looking at 4% annual appreciation before you see real profit. Does the market actually deliver that? If not, why are you buying?
Back to topMetric 6 — Tax Impact on Exit (Capital Gains and NIIT)
Your land gains get taxed as capital gains at the federal level. The rate depends on two things: how long you've held the property and what your taxable income looks like. For tax year 2026, per IRS Rev. Proc. 2025-32, here's what you're looking at:
- The 0% long-term capital gains rate applies to single filers with taxable income up to $49,450 and married-filing-jointly up to $98,900.
- The 15% rate applies up to $545,500 (single) or $613,700 (married filing jointly).
- The 20% rate applies above $545,500 for single filers.
- Short-term gains — on land held one year or less — are taxed as ordinary income at federal rates of 10%–37%. That's why hold period matters.
But here's where it gets painful for high earners. The 3.8% Net Investment Income Tax (NIIT) kicks in on top. It triggers at MAGI above $200,000 (single), $250,000 (married filing jointly), or $125,000 (married filing separately). And these thresholds? They're not inflation-adjusted, which means more people hit them every year. Combine the 20% top long-term capital gains rate with that 3.8% NIIT, and your effective top federal rate on land sale gains reaches 23.8% in 2026. That's real money walking out the door.
The 1031 like-kind exchange is your biggest tax deferral weapon. You can defer gains entirely by reinvesting your proceeds into replacement land or other qualifying real property. The timeline's strict: you've 45 calendar days to identify a replacement property and 180 calendar days to close. Under the standard 3-property rule, you can identify up to three properties, or more under the 200% rule. File IRS Form 8824 to document it. Here's the critical part: always work backward from your after-tax net proceeds in your exit scenarios. The pre-tax gain number is meaningless — it's not what you're actually keeping.


Metric 7 — Environmental and Physical Constraints
Environmental issues can kill a deal. They render land unbuildable, unmarketable, or both. And this is where most land investors get lazy. Before you write a check, you need to investigate:
- Wetlands: The rules here are a mess. Sackett v. EPA (2023) established a "continuous surface connection" standard for federal jurisdiction, but a conforming EPA/Army Corps rule was only proposed in late 2025 and still isn't final. Here's what actually matters: California, Washington, Minnesota, Wisconsin, Virginia, New Jersey, and New York all regulate wetlands independently. You could lose federal jurisdiction and it changes nothing in those states. Don't assume a parcel is buildable. Hire a qualified wetland delineator first.
- Floodplain: Your FEMA flood zone designation directly impacts financing, insurance premiums, and development cost. Get a flood zone determination and dig into any LOMA or LOMR history.
- Soil suitability: Two different questions here. For development, soil bearing capacity and shrink-swell potential hit your foundation costs hard. For septic systems, you need either a percolation test or soil-profile evaluation—and which one varies by state. Virginia and Delaware use soil-profile classification instead of a traditional perc test. Call your local health department and ask which protocol applies in your jurisdiction and whether any prior test results are still valid. Validity periods differ everywhere.
- Water rights and well access: Water rights don't automatically transfer with the deed. In the 17 prior-appropriation western states, water rights are separately allocated and often held by someone else entirely. Texas operates under its own rule of capture doctrine for groundwater. In Colorado, Arizona, New Mexico, Washington, Oregon, and Idaho, drilling a domestic well may require a permit—and you're not guaranteed one in closed basins. Talk to a local water attorney before you underwrite feasibility.
- Contamination: A Phase I Environmental Site Assessment is standard practice—do it. If recognized environmental conditions show up, a Phase II with soil and groundwater sampling comes next.
Metric 8 — Location Fundamentals and Infrastructure Proximity
Location analysis for land goes way deeper than just driving the neighborhood. You're not assessing what's there right now—you're predicting what's coming. Growth trajectory matters infinitely more than current conditions.
What should you actually be looking at?
- Population and employment growth: New metros and their exurban rings are where the development demand lives. Pull Census Bureau population estimates and Bureau of Labor Statistics employment data for the county and surrounding region. The numbers don't lie.
- Infrastructure proximity: Paved road access, water and sewer mains, electrical service, natural gas lines—every one of these directly impacts your development costs. But here's the thing: utility extension costs vary wildly by provider and tariff. Never assume anything's free or standard. Call the utility company and get the actual numbers before you commit.
- Traffic counts and visibility: Commercial land lives or dies on this metric. State DOT publishes annual average daily traffic (AADT) counts for adjacent arterial roads—they're public data and you need to pull them.
- School districts and municipal services: Residential development land buyers care deeply about school quality. This matters.
- GIS and mapping tools: County GIS portals, USDA Web Soil Survey, FEMA's Flood Map Service Center, and state environmental agency databases let you layer zoning, soils, floodplain, wetlands, and infrastructure on a single map before you set foot on the property. The USDA's Web Soil Survey is free. Paid platforms like LandVision, DataTree, or AcreValue will cut your analysis time in half.
Need to compare high-growth markets across regions? Best Markets for Land Investing: Data-Driven Analysis 2026 breaks down the current top performers with the data to back it up.
Back to topMetric 9 — Title Quality and Encumbrances
That smoking-gun price? Could be a red flag. Title problems kill deals all the time. They tank buyer interest, which is exactly why savvy sellers drop the asking price before you even walk through the door. Here's what actually kills properties:
- Gaps in the chain of title and unrecorded interests
- Easements — utility, access, drainage, conservation — that restrict use or development
- Liens — tax liens, mechanic's liens, judgment liens, and HOA liens — some of which survive foreclosure depending on state statute (lien priority rules are state-specific and change frequently)
- Boundary disputes and encroachments
- Mineral rights severance: In many states, the mineral estate can be severed from the surface estate and held by a third party, creating surface-use conflicts
- Heirs' property situations: Land passed through estates without formal probate can result in multiple fractional owners, clouded title, and financing difficulty. If you encounter a potential heirs' property situation, engage a real estate attorney experienced in partition law — and understand that purchasing a minority heir's interest to force a partition sale is the predatory practice the Uniform Partition of Heirs Property Act was designed to prevent
Get a preliminary title report early. Don't wait until closing — that's when surprises become disasters. Want the full lien deep-dive? Check How to Research Property Liens Before Buying Land: Complete Checklist. And if you need to know what seller documents actually matter, 10 Critical Seller Documents to Review Before Buying Investment Property walks you through the framework.
Back to topPutting It Together: A Land Analysis Workflow
Those nine metrics? They're a sequential filter, not a checklist you tick off in parallel. Kill deals fast. No legal access, environmental red flags, or zoning that kills your whole strategy—eliminate these before you waste a single hour on financial modeling. Save the heavy lifting (residual land value analysis, tax impact modeling) for parcels that actually made it through screening.
| Analysis Stage | Metrics Applied | Primary Tools | Decision Gate |
|---|---|---|---|
| Initial screening | Zoning, location, comparable sales (rough) | County GIS, MLS, LandWatch, Zillow | Pass / Eliminate |
| Physical due diligence | Environmental constraints, soil, title search | FEMA FMC, Web Soil Survey, title plant | Continue / Renegotiate / Walk |
| Financial modeling | Residual land value, ROI, cap rate (if income), holding cost | Spreadsheet model, appraisal software | Bid price / No-go |
| Exit planning | Capital gains tax, 1031 eligibility, holding period | Tax software, qualified intermediary | Net proceeds projection |
Investment Strategy Context: Matching Metrics to Your Approach
Not all land deals are created equal. A speculative hold banking on growth trajectory? Location and comps are basically everything. Farmland income plays flip the script—you're chasing cash rent yield, soil quality, and water access. Development flips live and die by residual land value and how fast you can get entitlements. Conservation easements operate under their own universe entirely, with IRS rules dictating the whole valuation game.
Here's the thing: your strategy determines which metrics actually matter. A farmland investor ignores cap rates on development upside. A speculator doesn't care about rent yield. And a conservation play requires knowing charitable contribution deduction requirements inside and out.
If you're building a passive land position as part of a larger portfolio, Best Passive Real Estate Investments: Guide for Lazy Investors stacks land against REITs, syndications, and other hands-off vehicles so you can see where it fits. Going all-in on active land flipping? Land Flipping Business: Step-by-Step Guide to Buying & Selling Raw Land walks you through acquisition and exit mechanics without the fluff.
Comparing land to multifamily or commercial income properties is another animal entirely. Check Multifamily Investment Analysis: Key Metrics and Strategies and How to Analyze Commercial Real Estate: Metrics, Tools & Process to see how those frameworks diverge from land analysis.
Back to topCommon Mistakes in Land Analysis
- Treating national averages as local benchmarks. That $6,020 per acre national average for cropland in 2026? It's meaningless for your deal. You've got Rhode Island running $34,300+ per acre while Plains states trade for a fraction of that. The variation is brutal. Pull county-level USDA data instead, and run comps against actual local sales—not some national mean that tells you nothing.
- Assuming water is available. Just because there's a utility line nearby doesn't mean you can tap it. Well drilling hinges on local hydrogeology and state water law—stuff you can't see in Google Earth. Get a hydrogeologist involved early or you'll be stuck.
- Underestimating the entitlement timeline. Rezoning takes time. Environmental review takes more time. Permitting? Don't even get me started. A project that pencils at 18 months can blow your returns if it actually takes 36. And it usually does.
- Ignoring state and local tax exposure. Rollback taxes hit when you flip an agricultural exemption. That's a surprise liability at closing that kills your margin. Every state writes these rules differently—call a local tax advisor before you bid, not after.
- Skipping a survey. Rural land constantly has boundary issues between what the deed says and where the fences actually sit. Fixing that post-closing is expensive and ugly.
- Conflating gross appreciation with net return. A parcel doubles in value over ten years. Sounds great until you realize it threw negative cash flow the whole time and you're staring down a 23.8% federal tax hit on the gain. Compare that against a diversified portfolio on an after-tax, risk-adjusted basis—it might lose.
Conclusion
Land analysis isn't like evaluating rental comps or commercial cap rates. You need a completely different toolkit. The nine metrics we've covered — zoning and entitlement potential, comparable sales, adapted cap rate, residual land value, ROI and holding cost, tax impact on exit, environmental constraints, location fundamentals, and title quality — give you a systematic framework to move from raw parcel to informed investment decision.
Here's what separates successful land investors from the rest: sequencing. Eliminate fatal flaws first. Then model finances only when a parcel clears the physical and legal screens. And always—always—build your tax exit analysis before you decide on a bid price. Land rewards patience and preparation in roughly equal measure. The investors who apply that combination consistently, and who resist the urge to fill analytical gaps with optimism, are the ones building durable positions in this asset class.
Just starting out? 10 Essential Steps for Buying Your First Investment Property gives you the foundational framework that complements the land-specific metrics covered here.
Back to top
Frequently Asked Questions
What's the most important metric when analyzing land for investment?
It depends on your strategy. There's no one-size-fits-all answer here. For development land, residual land value is usually the critical number—that's when you work backward from completed project value to figure out the maximum rational purchase price. Income-producing agricultural land? You're looking at cash rent yield relative to purchase price, basically your effective cap rate. Speculative raw land is different—comparable sales analysis and location growth indicators carry the most weight. But here's the thing: zoning and legal access are threshold questions in every case. If either is broken, no financial metric matters.
Can you use the cap rate to analyze land the same way you'd a rental property?
Only if the land actually generates measurable income—farmland cash rent, timber royalties, ground leases, that kind of thing. Most raw land produces zero income, which makes a straightforward cap rate calculation either impossible or meaningless. And even with income-producing agricultural land, you need to be careful about how you use those numbers. National averages like the 2026 USDA figure of $146 per acre for non-irrigated cropland cash rent and $6,020 per acre average cropland value are broad national means. They won't apply to your specific parcel or region.
How do capital gains taxes affect land investment returns in 2026?
They matter. A lot, especially if you're a high-income investor. Long-term gains (land held more than one year) get taxed at 0%, 15%, or 20% federally depending on your taxable income, with 2026 brackets set by IRS Rev. Proc. 2025-32. If your MAGI exceeds $200,000 (single) or $250,000 (married filing jointly), you're also paying a 3.8% Net Investment Income Tax, which pushes the combined top federal rate to 23.8%. Short-term gains—anything you hold for one year or less—get taxed as ordinary income at rates up to 37%, and that stings. But here's the good news: a 1031 exchange can defer these taxes if you reinvest in qualifying replacement property within the required 45-day identification and 180-day closing windows.
What environmental issues most commonly kill land deals?
Wetlands, floodplain designation, failed percolation or soil-profile evaluation for septic-dependent parcels, soil contamination, and inadequate water supply. These are the real deal-killers. Wetland jurisdiction is currently unsettled at the federal level following Sackett v. EPA (2023), but many states independently regulate wetlands anyway and may impose restrictions regardless of federal status. Don't skip the due diligence here. Always commission a wetland delineation, Phase I environmental assessment, and applicable soil or septic feasibility study before waiving contingencies on raw land.
Is farmland a good investment compared to other real estate asset classes?
Farmland has delivered consistent long-term appreciation—U.S. farm real estate values have jumped approximately 44% since 2020, hitting a national average of $4,500 per acre (land and buildings combined) in 2026, per USDA NASS. But the income yields are modest relative to price. You're also dealing with an illiquid asset that's management-intensive if you self-operate and subject to commodity price volatility when you're on a crop-share lease. It stacks up differently against multifamily or commercial real estate depending on your income requirements, tax situation, and holding period. Apply the same analytical discipline you'd use for any income property, just adjust for the land-specific metrics covered in this article.
Back to top