

Use our free house flipping calculator spreadsheet to estimate profits, analyze costs, and make confident investment decisions on every deal before you buy
Products and Tools Mentioned in this Post


Table of Contents
- What's a House Flipping Calculator Spreadsheet?
- Essential Features of a House Flipping Calculator
- How to Use a House Flipping Spreadsheet: Step-by-Step Guide
- Key Metrics You Should Track
- Excel vs. Google Sheets vs. Specialized Software
- Common Mistakes to Avoid When Using Flipping Calculators
- Advanced Tips for Maximizing Your Calculator
- Conclusion
- Frequently Asked Questions
Every successful house flip starts long before the first hammer swing. It begins with the numbers. A house flipping calculator spreadsheet is the single most important tool you can have in your investment arsenal. Here's why: it gives you the financial clarity to make confident offers, avoid costly mistakes, and protect your profit margins on every deal. Whether you're analyzing your first flip or managing a multi-property portfolio, the right spreadsheet turns guesswork into a disciplined, repeatable system. And that's non-negotiable if you want to scale.

What's a House Flipping Calculator Spreadsheet?
Definition and Purpose
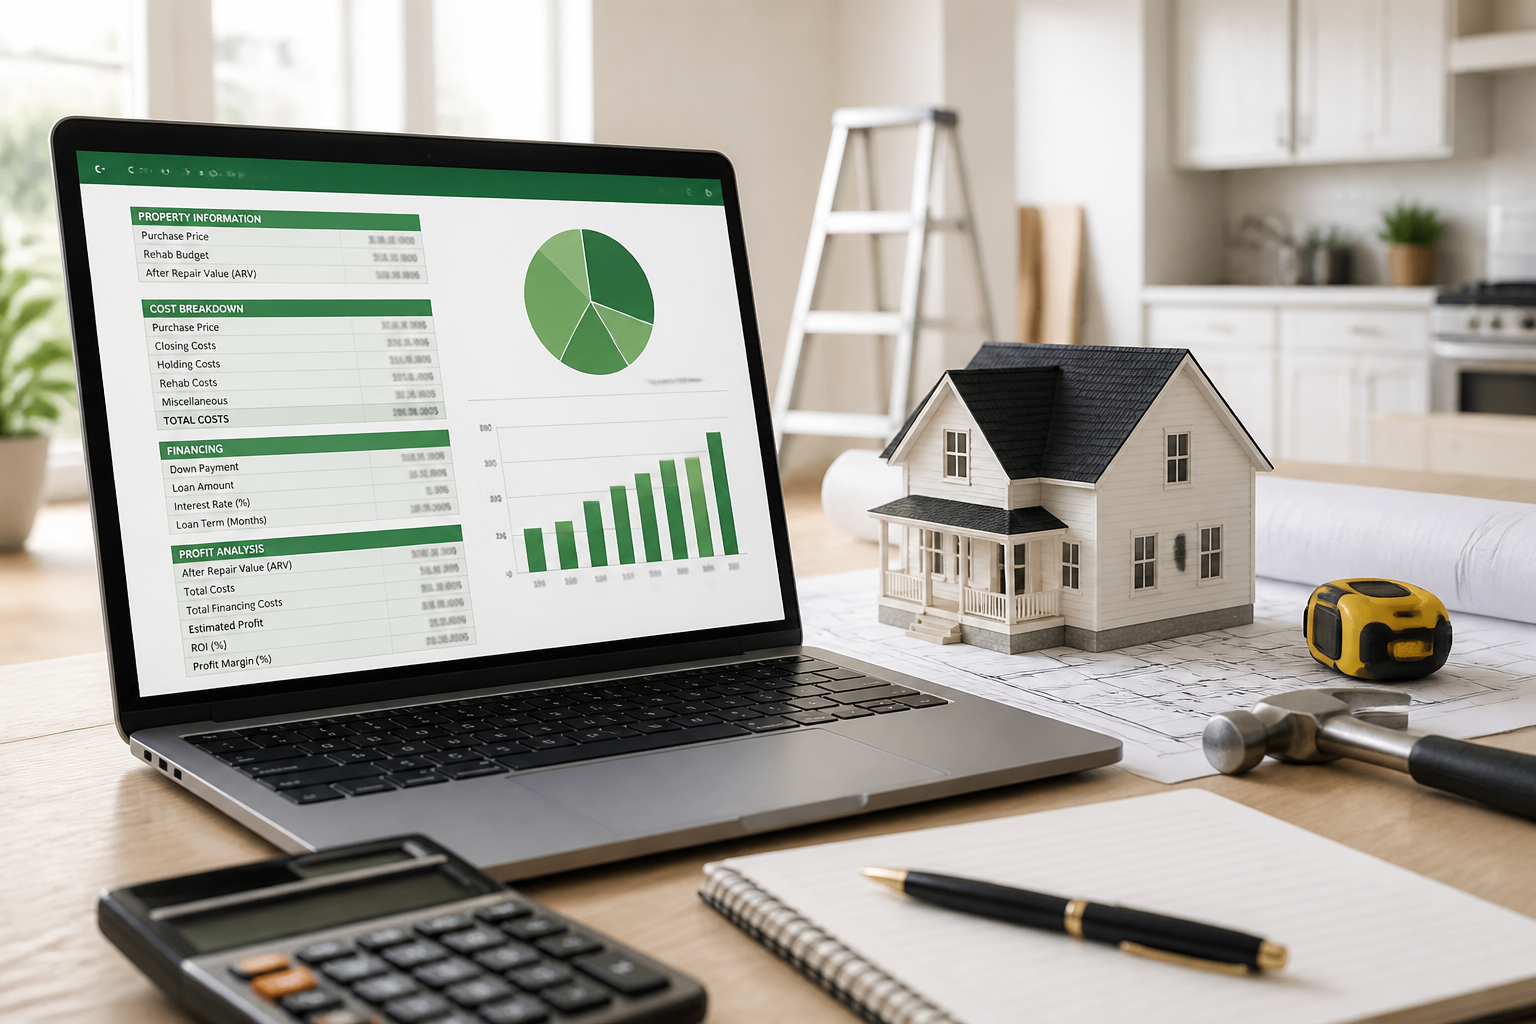
A house flipping calculator spreadsheet does one thing: it models the complete economics of a fix-and-flip project from acquisition through sale. You plug in your purchase price, rehab costs, holding costs, financing expenses, and projected sale price. Out comes a single dashboard that tells you whether a deal pencils or it doesn't—before you commit a single dollar.
Why Real Estate Investors Need One
ATTOM Data Solutions reported average gross profits on flipped homes ranging from $60,000 to $70,000 in recent years. But here's the catch: average ROI has been trending downward as markets tighten. That squeeze makes disciplined deal analysis non-negotiable. Most investors I know underestimate rehab costs by 20–30% and overestimate ARV without a structured analysis. What looked like a solid flip suddenly becomes break-even or worse. Want to get the fundamentals right? Check out our guide on unlocking the secrets to successfully flipping houses.
Key Benefits for Flippers
- Calculates your maximum allowable offer (MAO) based on ARV and the 70% rule
- Tracks rehab costs by category against budget in real time
- Models multiple exit scenarios (retail sale, rental hold, wholesale)
- Generates professional reports for lenders and partners
- Creates an auditable record for tax preparation
Essential Features of a House Flipping Calculator

Deal Analysis Components
Your spreadsheet needs to spit out ARV, MAO, projected net profit, ROI, and cash-on-cash return. These metrics tell you whether a deal's worth making an offer on. The 70% rule is solid — MAO equals 70% of ARV minus rehab costs — but honestly, tight markets often demand you tighten that threshold even more. What's your typical MAO percentage in your market right now?
Rehab Cost Estimation
Break everything down by trade. Foundation, roofing, plumbing, electrical, HVAC, flooring, kitchen, bathrooms, exterior — each one gets its own line. You want granular detail here. That's what kills most flippers: they lump rehab into one big number and then watch it balloon halfway through the project. Our room-by-room rehab cost breakdown will help you populate these fields without guessing.
Project Management Tools
The best spreadsheets track actual timelines. You need start and end dates for each trade, milestone checkpoints, and a contractor payment log. And here's the thing: timeline creep destroys margins faster than almost anything else.
Every month you're over schedule? That's another $3,000–$5,000 in holding costs eating into your profit.
Accounting and Reporting Features
You'll want built-in P&L summaries, tax deduction tracking (depreciation, loan interest, property taxes), and reports you can hand to hard money lenders. But if you want a platform that actually pulls all this together without three different spreadsheets, check out our FlipperForce 2026 review.
Back to topHow to Use a House Flipping Spreadsheet: Step-by-Step Guide

Step 1: Set Up Your Property Information
Start here. You'll enter the property address, purchase price, estimated ARV (pulled from comparable sales within 1 mile and the last 6 months), and your target profit margin. Everything else in your spreadsheet depends on getting this part right.
Step 2: Input Acquisition Costs
Title insurance. Transfer taxes. Inspection fees. Loan origination fees. Earnest money. These aren't sexy line items, but they add up fast—typically 2–5% of your purchase price. And most new investors completely blank on them. Don't be that person.
Step 3: Enter Rehabilitation Expenses
Separate hard costs (materials and labor) from soft costs (permits, architectural drawings, inspections). Then add a 10–15% contingency buffer on top of your line-item total. Because surprises happen. For a deeper dive on cost estimation for wholesale deals, check out how to estimate rehab costs for wholesale deals.
Step 4: Calculate Holding Costs
This is where people get hurt. Loan interest, property taxes, insurance, utilities, HOA fees—calculate all of it monthly, then multiply by your projected hold period. Take a $200,000 hard money loan at 12% annual. You're bleeding $2,000/month in interest alone. Stretch that project to six months? You've just eaten $12,000 before you've even started swinging hammers.
Step 5: Analyze Profit and ROI
Your spreadsheet does the heavy lifting: Net Profit = Sale Price − Purchase Price − Rehab Costs − Holding Costs − Selling Costs. Don't forget selling costs either. Agent commissions, staging, closing credits—they'll take another 8–10% of your sale price right off the top.
Step 6: Generate Reports
Export a clean one-page deal summary. Show it to lenders and partners. A professional report builds credibility fast and gets loan approvals moving.
Back to topKey Metrics You Should Track

| Metric | Formula | Target Benchmark |
|---|---|---|
| Maximum Allowable Offer (MAO) | (ARV × 70%) − Rehab Costs | Varies by market |
| Net Profit | Sale Price − All Costs | ≥ $25,000 minimum |
| ROI | (Net Profit ÷ Total Investment) × 100 | ≥ 15–20% |
| Cash-on-Cash Return | (Net Profit ÷ Cash Invested) × 100 | ≥ 20% |
| Annualized ROI | (ROI ÷ Hold Months) × 12 | ≥ 30% |
| Break-Even Sale Price | Purchase Price + All Costs | Well below ARV |
You need to know where the real margin lives. That's why understanding which markets actually deliver on profit potential matters just as much as your math does. Take a look at our breakdown of the best markets for house flipping in 2026 — it'll help you lock in your ARV assumptions instead of guessing.
Back to topExcel vs. Google Sheets vs. Specialized Software

| Platform | Cost | Collaboration | Customization | Mobile | Best For |
|---|---|---|---|---|---|
| Excel Templates | Free–$30 | Limited | High | Moderate | Solo investors, advanced users |
| Google Sheets | Free | Excellent | High | Good | Teams, partnerships |
| FlipperForce | $79–$129/mo | Built-in | Moderate | Excellent | Active flippers, project management |
| DealCheck | Free–$20/mo | Limited | Moderate | Excellent | Quick deal screening |
| REI/kit | $49/mo | Good | High | Good | Growing portfolios |
Working with a partner or a VA? Google Sheets is your answer. The real-time collaboration is seamless, and everyone stays on the same page without the headaches of version control. Excel is different — it's built for solo operators or power users who need total control over their underwriting models. You can layer in custom formulas, IRR calculations, and ARV projections exactly how you want them.
Don't sleep on purpose-built tools, though.
Check out our best house flipping software for 2026 roundup for a deeper dive into platforms like FlipperForce ($79–$129/mo) and DealCheck (free or $20/mo). And if you're running BRRRR deals alongside flips? Grab our BRRRR spreadsheet template to track both strategies in one system.
Back to topCommon Mistakes to Avoid When Using Flipping Calculators
Underestimating Rehabilitation Costs
New investors consistently lowball by 20–35%. And it kills deals. Here's what I tell every first-timer: if you haven't walked the property with a contractor in hand, add 20% to every single estimate. Structural issues hide. Mold spreads. Outdated electrical panels don't upgrade themselves. Permit requirements pile up fast.

Ignoring Holding Costs
Let's run real numbers. Say you're holding a $250,000 hard money loan at 12% interest for six months. Add $400/month in taxes and $150/month in insurance. You're looking at over $16,000 in holding expenses alone—and that's before you sell.
Most investors skip this line entirely. Don't be that person.
Overestimating ARV
This is the #1 reason deals blow up. You need closed sales—not list prices—from the past 90 days in your tight geographic radius. Then adjust for square footage, condition, and what you're actually upgrading. Inflated ARV kills your projected returns before you even break ground.
Miscalculating Financing Costs
Hard money lenders bury origination points (1–3% of loan amount) on top of interest. A $200,000 loan with 2 points? That's $4,000 out of pocket upfront. But it's easy to miss if you're not building it into your acquisition cost section explicitly.
Not Building in Contingencies
You need 10–15% of your rehab budget sitting in contingency. Not as a nice-to-have. As a requirement. Permitting delays happen. Weather stops work. Contractors ghost. Hidden damage is the norm, not the exception.
The flippers who stay in business for years? They plan for this. Everyone else learns the hard way.
Back to topAdvanced Tips for Maximizing Your Calculator
Scenario Planning and Sensitivity Analysis
Run three scenarios on every deal. That's optimistic (ARV hits, rehab stays on budget), base case (10% cost overrun, 5% ARV reduction), and pessimistic (20% cost overrun, 10% ARV reduction). And here's the real test: if your pessimistic scenario still shows profit, you've got a strong deal. This is what separates the pros from the amateurs—downside protection analysis.
Multi-Property Portfolio Tracking
Build a master dashboard tab that pulls the key metrics from all your individual deal tabs. Total capital deployed, combined projected profit, blended ROI, active project timelines—it's all there. Why? Because you need to see your whole portfolio at once if you're managing cash flow across multiple simultaneous flips.
Automating Calculations
Data validation drop-downs for cost categories. Conditional formatting to flag any deals that fall below your minimum ROI threshold. IFERROR functions to stop formula crashes when cells are empty.
This automation cuts human error and kills deal screening time.
Integration with Deal Management
Connect your spreadsheet to your CRM or deal pipeline tracker. Each property moves from lead to offer to active flip to sold—and your data flows right along with it. Some investors use Zapier to auto-populate spreadsheet rows straight from inbound deal submissions. That's how you eliminate hours of manual data entry every month.
Back to topConclusion
A well-built house flipping calculator spreadsheet isn't a luxury. It's the foundation of every profitable flip. It forces discipline before you fall in love with a property, protects your margins when surprises arise, and creates the professional paper trail that lenders and partners require. Start with a solid free template in Google Sheets or Excel. Add your contingency buffers. Stress-test your ARV assumptions. Then upgrade to specialized software as your deal volume grows. The investors who consistently profit in any market? They're the ones who trust their numbers over their gut — and their spreadsheet over their optimism.
Back to topFrequently Asked Questions
How accurate should my estimates be before making an offer?
Your ARV needs to land within 5% of what the market actually says. After a physical walkthrough, your rehab estimate should be within 15%. Before you've walked the property? Treat any number as directional—nothing more. And don't ever wire earnest money based on photos or a drive-by.
What if my actual costs don't match my spreadsheet projections?
The moment costs shift, update your spreadsheet and rerun the profit analysis. If those new numbers dip below your minimum ROI threshold, you've got three plays: renegotiate with the seller (if you're still in contract), cut costs from the rehab scope, or swallow a smaller profit margin. Pretending the variance doesn't exist won't change reality.
Can I use the same spreadsheet for different property types?
You can—but only if you modify it properly. Single-family flips, condos, and multi-family deals live in completely different cost universes. They've got different rehab expenses, holding costs, and exit strategies. Create separate template tabs for each property type. Forcing one template across all scenarios is how you blow your projections.
How often should I update my calculations during an active flip?
Weekly. That's your minimum. Every single week, compare actual costs to budget and adjust your projected completion date if the schedule drifts. Recalculate your profit forecast every month. Catching budget creep early gives you real time to fix it before small overruns turn into deal-killers.
Is the 70% rule still valid in today's competitive markets?
The 70% rule is a screening tool—not gospel. In hot markets with fast appreciation, plenty of investors crush deals at 75–80% of ARV. But in slower markets or during recession cycles? You'll want 65% or lower. Always run your actual numbers instead. The 70% rule just tells you where to start the negotiation.
Back to top